
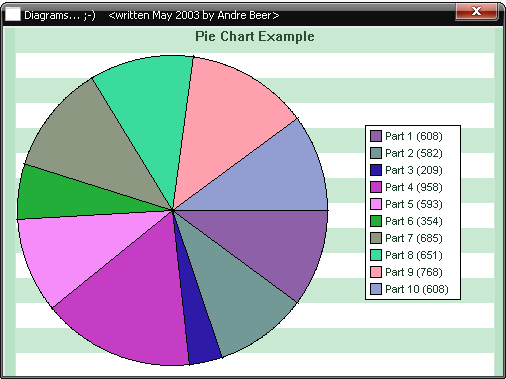
Круговая диаграмма
Code
; **** Pie Chart - Diagram ****
; Created: 1st/2nd May 2003 by Andre Beer / PureBasic-Team (www.purebasic.com)
; Many thanks to David "Tinman" McMinn for fixing the filling routine :-)
;-Init
ImW.w = 500 ; Width of diagram in pixel \ in this case also the (inner) window
ImH.w = 350 ; Height of diagram in pixel / dimensions....
MaxValue.w = 1000 ; Maximum individual value stored in the diagramm values
Graphs.w = 10 ; Number of sectors (graphs) in the diagram
Values.l = 1 ; Decide, if the relating sector values will be printed inside the descriptions box
; 0 = print only the sector name (in this example: Part 1, Part 2, etc.)
; 1 = print the sector name as well the relating value (in this example: Part 1 (Value1), Part 2 (Value2), etc.)
Color.l = 2 ; Number of color-style, currently included only three:
; 0 = blue style
; 1 = brown style
; 2 = green style
;-Structures
Structure Diagram
Value.l ; Value
Text.s ; Description of the individual charts sectors
Color.l ; Color for filling the area of this sector
EndStructure
Structure Style
Front1.l ; 1st foreground color (main)
Front2.l ; 2nd foreground color (lighter)
Front3.l ; 3rd foreground color (darker)
Back1.l ; 1st background color (lighter)
Back2.l ; 2nd background color (darker)
Bottom.l ; Color of the bottom bar
Title.l ; Title color
Text.l ; Text color (axis descriptions)
EndStructure
; Init array (item 0 is used for general settings, item 1 until Graphs+1 contains the diagram data
Global Dim Stats.Diagram(Graphs+1)
;-ColorStyles
Global Dim Colors.Style(3)
; Set blue color-style
Colors(0)\Front1 = RGB(71,71,108)
Colors(0)\Front2 = RGB(140,140,183)
Colors(0)\Front3 = RGB(49,49,75)
Colors(0)\Back1 = RGB(201,211,233)
Colors(0)\Back2 = RGB(184,197,226)
Colors(0)\Bottom = RGB(255,255,255)
Colors(0)\Title = RGB(0,0,255)
Colors(0)\Text = RGB(0,0,0)
; Set red-brown color-style
Colors(1)\Front1 = RGB(108,71,71)
Colors(1)\Front2 = RGB(183,120,120)
Colors(1)\Front3 = RGB(75,49,49)
Colors(1)\Back1 = RGB(233,211,201)
Colors(1)\Back2 = RGB(226,197,184)
Colors(1)\Bottom = RGB(243,232,226)
Colors(1)\Title = RGB(255,0,0)
Colors(1)\Text = RGB(240,0,0)
; Set green color-style
Colors(2)\Front1 = RGB(71,108,71)
Colors(2)\Front2 = RGB(120,183,120)
Colors(2)\Front3 = RGB(49,75,49)
Colors(2)\Back1 = RGB(201,233,211)
Colors(2)\Back2 = RGB(184,226,197)
Colors(2)\Bottom = RGB(223,242,228)
Colors(2)\Title = RGB(49,75,49)
Colors(2)\Text = RGB(24,58,35)
;-Procedure
Procedure Pie(ID.l, Count.l, x.l, y.l, Width.l, Height.l, Color.l, Title.s)
; ID = Output-ID for drawing operations (e.g. WindowOutput, ImageOutput, etc.)
; Count = Value-/Bars-number
; x, y = top-left corner of the diagram in pixel
; Width = Width of diagram in pixel
; Height = Height of diagram in pixel, including title line and text line
; Color = number of color-style
; Title = String with the text, which should be printed as title line
; Initial values
#Resolution = 65 ; Resolution is the part used for the pie-chart in percent, the other part is used for the description on the right side
#Border = 10 ; Border (in pixel) on left and right side of the pie-chart
AngleStart.f = -#PI ; needed later for calculating the circle-parts
AngleEnd.f = 0 ; defines where the drawing starts: 0 = right, #Pi = left, #Pi/2 = bottom, -#Pi/2 = top
#TitleBar = 20 ; Height of the Title bar area
#TitleFontHeight = 10 ; Font height of the Title text
#TextFontHeight = 8 ; Font height of the Description text
#White = 16777215 ; Set the value of RGB(255,255,255) to a white color constant
; Calculate initial chart values
LeftWidth = Width * #Resolution / 100
temp1.l = (LeftWidth - #Border - 5) / 2
temp2.l = (Height - #TitleBar - 5) / 2
If temp1 < temp2
Radius.l = temp1
Else
Radius.l = temp2
EndIf
MX.l = x + #Border + ((LeftWidth-#Border) / 2)
MY.l = y + temp2 + #TitleBar
; Count the sum of all graphs value (=100%)
For a=1 To Count
Sum.l + Stats(a)\Value
Next
; Load fonts
FontID.l = LoadFont(1, "ARIAL", #TitleFontHeight, #PB_Font_Bold | #PB_Font_HighQuality)
FontID2.l = LoadFont(1, "ARIAL", #TextFontHeight, #PB_Font_HighQuality)
StartDrawing(ID)
; Paint background (used similar one as in Bars-Chart example, I was too lazy to create a new one ;-)
#Title = 24
#Bottom = 15
Box(x,y,Width,Height,Colors(Color)\Back1) ; paint lighter background fullsize
Box(x,y,#Border,Height,Colors(Color)\Back2) ; paint darker bar at left
Box(x+Width-#Border,y,#Border,Height,Colors(Color)\Back2) ; paint darker bar at right
For a = y+25 To Height Step 50
Box(x+#Border+1,a,Width-(2*#Border)-2,25) ; paint darker background bars
Next a
; Paint title string
FrontColor(Colors(Color)\Title)
DrawingMode(1) ; set drawing-mode to 1 for transparent text drawing
DrawingFont(FontID)
DrawText(x+(Width-TextWidth(Title))/2, y, Title)
FrontColor(0)
For id=1 To Count
AngleStart = AngleEnd
AngleEnd = AngleStart + (Stats(id)\Value * 2 * #PI / Sum)
; Set black as default color for all border lines
FrontColor(0)
; Draw the lines from inside the circle to the border
LineXY(MX,MY,Cos(AngleStart)*(Radius+1)+MX,Sin(AngleStart)*(Radius+1)+MY) ; note: Radius must be increases by 1 here,
LineXY(MX,MY,Cos(AngleEnd)*(Radius+1)+MX,Sin(AngleEnd)*(Radius+1)+MY) ; because otherwise sometimes misses a pixel
; Draw the circle
For a = AngleStart * Radius To AngleEnd * Radius ;Step 2
px.l = Cos(a / Radius) * Radius + MX
py.l = Sin(a / Radius) * Radius + MY
Plot(px, py)
Next
; Calc the coordinates for filling point and finally fill the selected area
px = Cos((AngleEnd + AngleStart) / 2)*(Radius / 2) + MX
py = Sin((AngleEnd + AngleStart) / 2)*(Radius / 2) + MY
FillArea(px,py,0,Stats(id)\Color)
Next
; Now draw the descriptions on the right side
#LineHeight = #TextFontHeight + 4
#LineSpace = 5
; Find the widthest string
For id=1 To Count
temp1 = TextWidth(Stats(id)\Text)
Next
temp1 + #LineHeight
temp2 = (Width - LeftWidth - temp1) / 2
If temp2 <=0 : temp2 = 0 : EndIf
px = x + LeftWidth + temp2
temp2 = (#LineHeight * Count) + (#LineSpace * (Count-1))
py = y + #TitleBar + ((Height - temp2 - #TitleBar) / 2) ; Image height decreased by needed height for the text descriptions
DrawingFont(FontID2)
; paint white background box with black borders
DrawingMode(0)
Box(px-4,py-4,temp1,(#LineHeight+#LineSpace)*Count+4,#White)
DrawingMode(4)
Box(px-5,py-5,temp1+2,(#LineHeight+#LineSpace)*Count+5,0)
Line(px-3+temp1,py-4,0,(#LineHeight+#LineSpace)*Count+5)
Line(px-4,py+(#LineHeight+#LineSpace)*Count,temp1,0)
; paint the color boxes with relating description
For id=1 To Count
Box(px,py,#LineHeight,#LineHeight,0)
DrawingMode(0)
Box(px+1,py+1,#LineHeight-2,#LineHeight-2,Stats(id)\Color)
DrawingMode(1)
FrontColor(Colors(Color)\Text)
DrawText(px + #LineHeight + 4, py-1,Stats(id)\Text)
py + #LineHeight + #LineSpace
Next
StopDrawing()
EndProcedure
;- Diagram data
; Store some general values
Stats(0)\Value = MaxValue ; value is relating to 100% diagram height, must correspond to (at least) the greatest individual value!!!
; Fill data array
For a=1 To Graphs
; Fill value
Value = Random(MaxValue-1)+1 ; the values should be at least 2
Stats(a)\Value = Value
; Fill x-Axis
If Values=0
Stats(a)\Text = "Part "+Str(a)
Else
Stats(a)\Text = "Part "+Str(a)+" ("+Str(Value)+")"
EndIf
; Fill color
Red = Random(255)
Green = Random(255)
Blue = Random(255)
Stats(a)\Color = RGB(Red,Green,Blue) ; currently here are used random colors, feel free to set your own's ;-)
Next a
; Set some fixed values instead of random numbers (delete the ";" in front of the lines if wanted)
;Stats(1)\Value = 10
;Stats(2)\Value = 20
;Stats(3)\Value = 30
;-Main Programm
OpenWindow(0,100,200,ImW,ImH,"Diagrams... ;-) <written May 2003 by Andre Beer>",#PB_Window_SystemMenu|#PB_Window_ScreenCentered)
;-Create Image
If CreateImage(0,ImW,ImH)
StartDrawing(ImageOutput(0))
Box(0,0,ImW,ImH,$FFFFFF)
StopDrawing()
Else
Debug "Error when creating image..."
End
EndIf
;-Call Diagram
; Parameters: OutputID, Elements, x, y, Width, Height, Colorstyle, Title-String
Pie(ImageOutput(0), Graphs, 0, 0, ImW, ImH, Color, "Pie Chart Example")
WinID.l = WindowID(0)
ImageGadget(0,2,2,300,220,ImageID(0))
;- Main loop
Repeat
Event = WaitWindowEvent()
Select Event
Case #PB_Event_CloseWindow
Quit = #True
EndSelect
Until Quit
End
www.purebasic.info/
www.purebasic.com
www.purebasic.mybb.ru
www.www.purebasic.fr/english
www.www.purebasic.fr/german
Сайт посвящён языку программирования PureBasic — коммерческий компилятор языка программирования, использующего синтаксис BASIC. Предназначен для создания кроссплатформенных приложений для AmigaOS, Linux, Microsoft Windows, Windows NT и Mac OS X. Разработан компанией Fantaisie Software.

